What You Will Do:

- Watch the Khan Academy video "Trapezoidal Approximation" and learn how it relates to work done on a gas.
- Use the Observe Pressure Sensor to collect pressure data in the Desmos Graphing Calculator as you do work to decrease the volume of a syringe.
- Construct trapezoids in Desmos to estimate the area under your pressure-volume (PV) curve.
- Convert the sum of trapezoid areas to determine the total work done on the gas during compression, expressed in Joules.
- Gas particles: tiny molecules moving in constant, random motion.
- Pressure: the force created by gas particles striking the walls of a container.
- Volume: the amount of space available for those particles to move around in.
- Work: when you press the syringe plunger inward, you apply a force and the plunger moves. Work is defined as a force acting over a distance.
- Area under the PV curve: the force needed to push the plunger is not constant— it increases as the gas is compressed. On a pressure–volume graph, the area under the curve represents the total work done on the gas.
- Click to watch this Khan Academy video to learn more about these concepts.
- Click this link Pressure - Activity 2 to open the worksheet in a new browser tab. Click 'Make a copy' to save your version to your Google Drive.
- Click the Show Directions button in the upper-right corner to learn how to collect data for this activity.
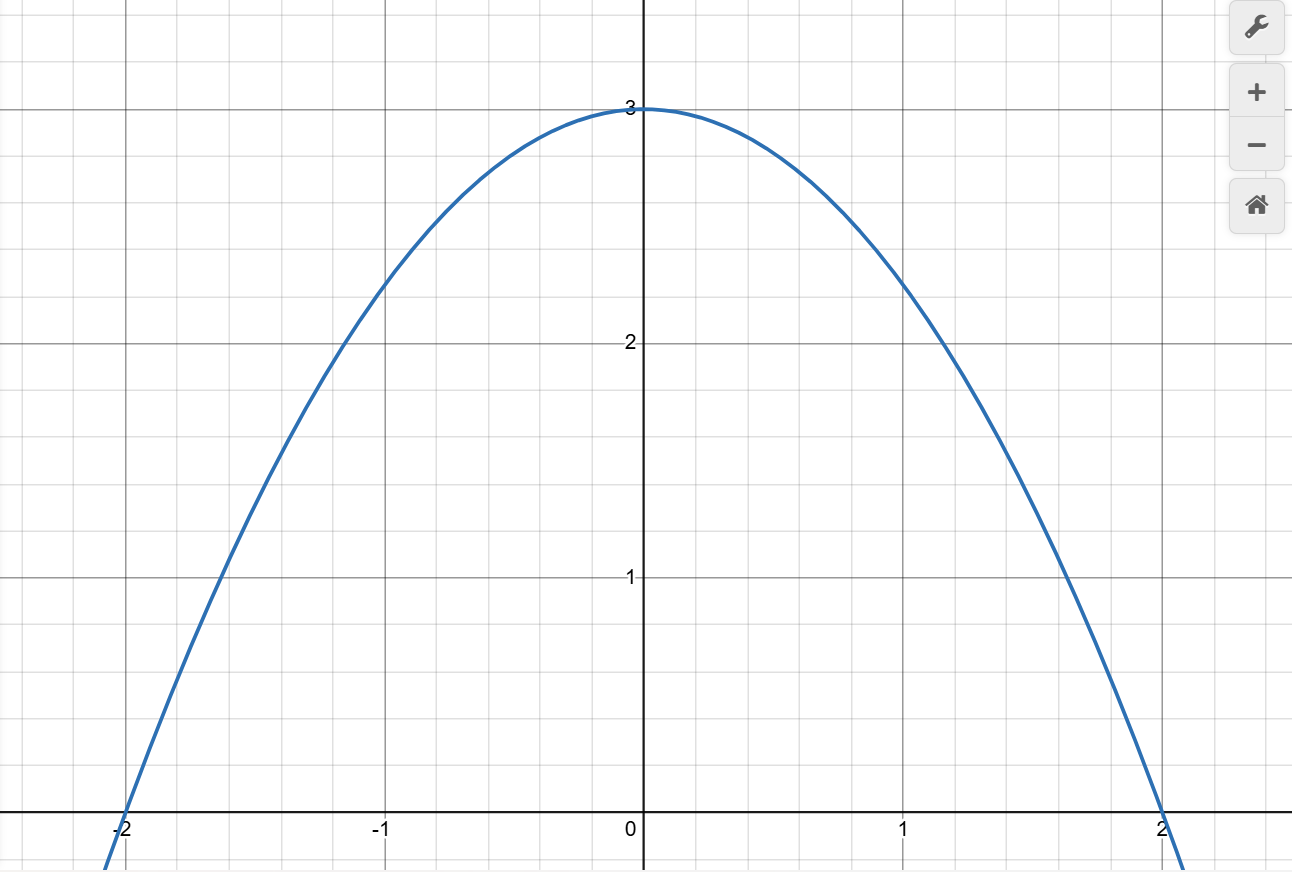
- Imagine the area under the curve below divided into four trapezoids, each with a width of 1 along the x-axis. Do you see how adding the areas of these trapezoids provides an approximation of the true area under the curve?
- Use your mouse to click and drag on the graph below to draw four equal-width trapezoids under the curve. Click the Erase Drawing button if you need to start over.
- When you are satisfied, click Capture Drawing to copy the image to the clipboard and paste it into your worksheet for this activity.
Directions:
Data Collection:
- Use a USB-C cable to plug the Observe pressure sensor into your computer's USB port.
- Click the Connect Sensor button to activate the sensor.
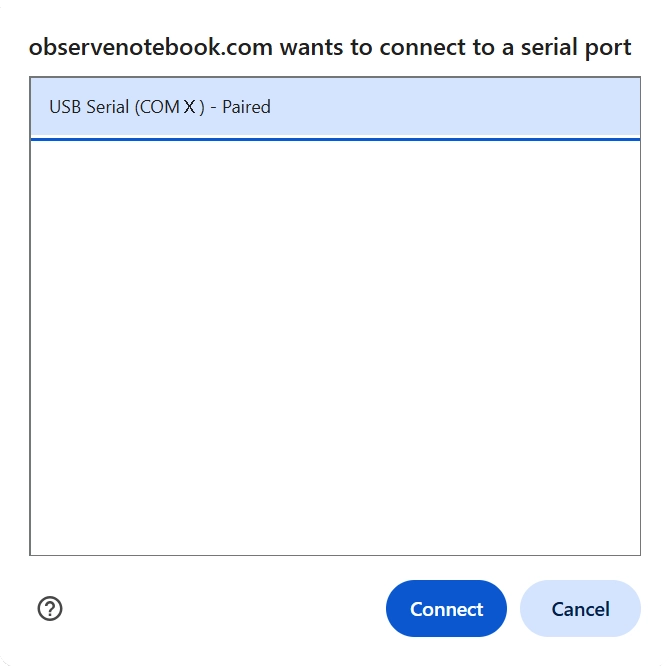
- Select the USB serial port (COM X). The X value varies by computer and is not important. Then click the blue Connect button in the pop-up window. The status will change to ready.
- Adjust the plunger of the syringe to exactly 20 mL and attach the syringe to your pressure sensor. Notice the pressure reading in units of kilopascals (kPa) above the graph. Pressing the plunger down to reduce the volume causes the pressure to increase.
- Add measurements one at a time by pressing the Add Point button. When pressed, you are prompted for the x-value for the corresponding y measurement. Your first point should be 20 mL. Next, reduce the volume to 19 mL and add another point. Continue reducing the volume by 1 mL and adding points until a volume of 5 mL.
- Clear Graph resets; Capture Graph copies an image of the graph to the clipboard; Export/Import saves or opens a CSV data file.
- Click the small gray triangle to the left of the data table to view the sensor data (V, P, and A) in the table.
- Click the Show Instructions button in the upper right to continue with analysis of the data.
- Click the Show Directions in the upper-right corner to learn how to collect temperature data for this activity.
-
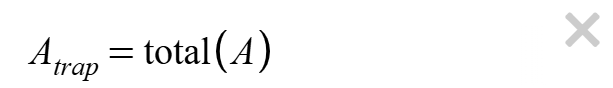
Click the
button to apply the trapezoid rule. The area of each trapezoid will appear in
column A of the data table.
Find the total approximate area under the PV curve. Enter the equation (use the underscore key _ to make the subscript) below in the Desmos expression window.
- Convert your trapezoid sum from kPa·mL to Joules by rewriting the units in SI form: 1 kPa = 1,000 Pa and 1 mL = 1×10⁻⁶ m³. Since 1 kPa·mL = 1×10⁻³ J, multiply your result by 0.001 (because 1,000 × 1×10⁻⁶ = 1×10⁻³) to obtain the work in Joules. Multiply the total area by .001 in the Desmos expression window.
-
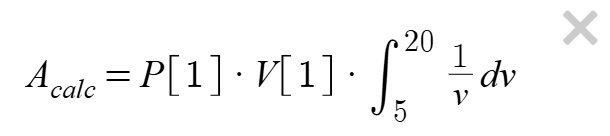
Calculate an accepted value by evaluating the definite integral from 4 mL to 20 mL
using Boyle's Law for an isothermal compression and compare this exact value
with your trapezoid-rule approximation for the same interval. Enter the equation below in the Desmos expression window.
- Try Boyle's Law: Pressure–Volume to explore mathematical modeling of the relationship between the pressure and volume of a gas.
- Try Temperature and Molecular Motion to learn how statistical models can describe the motion of particles in a gas.