What You Will Do:
- Explore how air molecules move at different temperatures and how their speeds form a Maxwell–Boltzmann distribution (a curve that shows the spread of speeds in a gas).
- Use your Observe Temperature Sensor to collect real-time temperature data, and watch the predicted particle-speed distribution shift as the air warms or cools.
- In Desmos, analyze a histogram of simulated molecular speeds and compare it to the theoretical Maxwell–Boltzmann curve and the calculated root-mean-square speed (Vrms).
- Use quartiles and the minimum/maximum to measure the right-hand tail of the speed histogram (how far the fastest particles extend), and connect that tail to higher-energy collisions in chemistry.
- Watch the Khan Academy video “Maxwell-Boltzmann Distribution” to see how temperature changes the shape and position of the speed distribution.
- The root-mean-square speed (Vrms) is one way to describe a typical molecular speed. In this simulation, Vrms is calculated from the temperature measured by the sensor. $$v_{\text{rms}} = \sqrt{\dfrac{3\,k_B\,T}{m}}$$
- The Maxwell–Boltzmann distribution shows how molecular speeds are spread out at a given temperature. As temperature increases, the distribution shifts toward higher speeds, and Vrms increases too. The curve and histogram below update based on the sensor’s temperature. $$f(x) = 4\pi\!\left(\frac{m}{2\pi k T}\right)^{\!3/2} x^{2}\, e^{-\frac{mx^{2}}{2kT}} \left\{x \ge 0\right\}$$
- Notice the histogram has a long right-hand tail, meaning a small number of molecules have very high speeds. In chemistry, these fast molecules are more likely to collide with enough energy for a reaction, so higher temperature often makes reactions happen faster.
- Click this link Temperature - Activity 3 to open the worksheet in a new browser tab. Click “Make a copy” to save it to your Google Drive, then use the simulation to answer the questions.
- Click to watch the Khan Academy video to learn more about these concepts.
- Click the Show Directions in the upper-right corner to learn how to collect temperature data and begin the simulation for this activity.
Directions:
Data Collection:
- Use a USB-C cable to connect the Observe Temperature Sensor to your computer’s USB port.
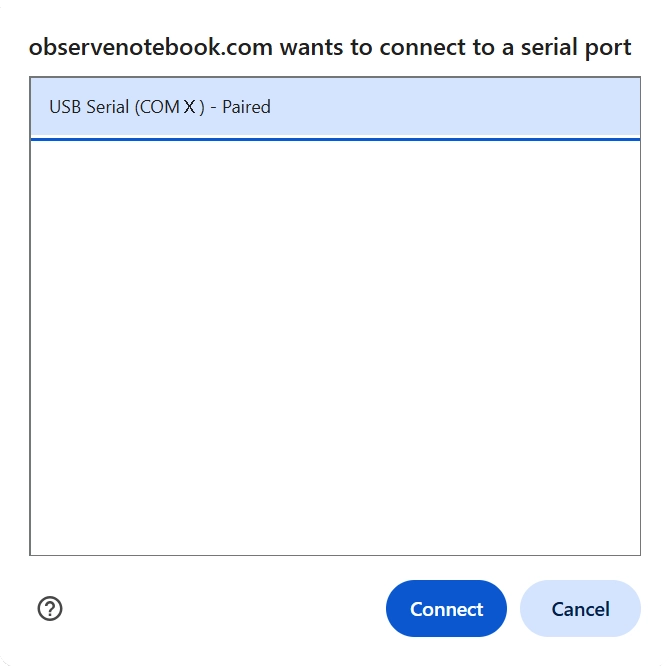
- Click the Connect button in the top-left corner of this page.
- Select the USB serial port (COM X) and click Connect. The “X” varies by computer.
- Confirm that the status in the top-right corner says “connected.”
- Hold the sensor in hot water for 30 seconds and observe the temperature increase.
- Click the Show Instruction button in the upper-right corner to continue the activity.
- Click Start Collection and allow the sensor to cool to room temperature. Then click the Stop Collection button.
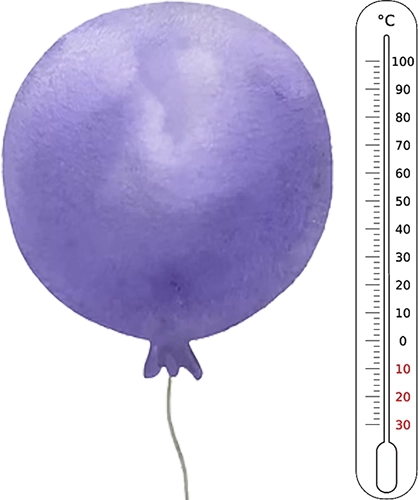
- Observe how the hot particles (red) and cool particles (blue) in the balloon exchange energy.
- Watch the Vrms display during collection. As the sensor cools, note how the root-mean-square molecular speed changes.
- Observe the histogram of molecular speeds as the temperature changes. Notice how the shape, center, and spread of the histogram shift as the gas cools.
- In the Desmos expression list, find the 10th percentile of particle speeds. Enter: $$p_1 = \operatorname{quantile}(V,\,.1)$$
- Find the 90th percentile of particle speeds. Enter: $$p_9 = \operatorname{quantile}(V,\,.9)$$
- Calculate the left tail length — the distance from the first quartile down to the 10th percentile. Enter: $$L = \operatorname{quartile}(V,1) - p_1$$
- Calculate the right tail length — the distance from the 90th percentile up to the third quartile. Enter: $$R = p_9 - \operatorname{quartile}(V,3)$$
- Calculate the tail asymmetry ratio. A value greater than 1 confirms the distribution has a longer right tail. Enter: $$\dfrac{R}{L}$$
- When finished, click Capture Graph button to copy your graph and paste it into your Google Docs worksheet. Answer all of the questions in your Google Docs worksheet and follow your teacher's directions for turning in your worksheet.
- Repeat the activity with the sensor starting in ice water and warming to room temperature.
- When finished, click Capture Graph to copy your graph and paste it into your Google Docs worksheet in the second graph placeholder.
Vrms = —
Analyzing Your Data: