What You Will Do:
Analyzing Your Data:
- Create a small grayscale image by building a 7×5 light map: each square acts like one pixel that stores a measured light value.
- Calibrate the pixel range by sampling a dark and a bright condition, then click Sample to fill each pixel. The page automatically averages 10 sensor readings and converts the result into a 0–255 grayscale value.
- Treat your image as a dataset: use a histogram of pixel values and summary measures (mean/median and spread) to describe the overall brightness pattern in your light map.
- Watch this video to learn how digital images are mathematically represented and stored in an image file. This video will provide context and meaning for this activity.
- Light intensity (lux): how much light energy reaches the sensor’s surface.
- Grayscale pixel value: a number from 0 (black) to 255 (white). A value like (125,125,125) is a medium gray. The 0–255 range is used because one grayscale value is stored in a single byte—an 8-bit binary number that can represent 256 different values.
- In this activity, each square is like one “pixel.” Each time you sample, you measure the light and store it as a number.
- Watch this video to learn how digital images store light information as data (pixels). It provides context for why we build a “light map” and why pixel values can be analyzed statistically.
- Click this link Light - Activity 2 Worksheet to open the worksheet in a new browser tab. Click Make a copy to save your version to your Google Drive.
- Click Show Directions to set up the sensor and learn how to collect your light map.
Directions:
Data Collection:
- Use a USB-C cable to plug the Observe light sensor into your computer’s USB port.
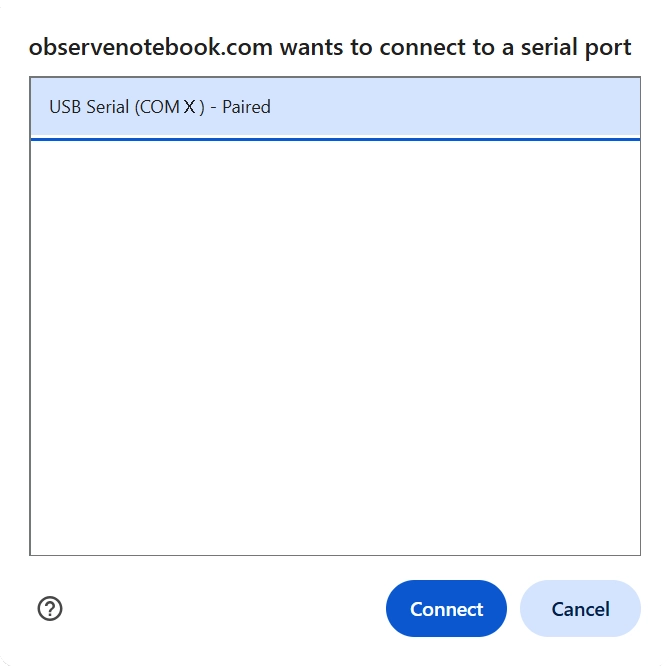
- Click Connect. Select the USB serial COM X port (the number X is different for each PC), and then click the blue Connect button in the pop-up window. The status will change to ready.
- Choose a scene to “scan.” Pick something with a clear bright region (like a window or lamp) and a darker region (like a shadowed corner).
- Set the dynamic range for your grayscale image. Aim the sensor at the darkest part of the scene, hold it steady, and click Dark. Then aim at the brightest part of the scene, hold it steady, and click Bright.
- Build your 5×7 pixel light map by sampling the scene row by row. Start at the upper-left of your scene. Hold the sensor steady at that position and click Sample to record the first pixel.
- Shift your aim slightly to the right to the next position. Hold still, then click Sample again. Continue across the row, using 7 evenly spaced positions from left to right.
- When the row is complete, tilt the sensor slightly downward (one step) to start the next row. Repeat the same left-to-right scan until the full 5×7 grid is filled.
- The red outline shows which pixel will be filled next. Try to keep your step size consistent so your light map forms a recognizable “image” of the scene.
- Tip: for each pixel, pause briefly so the sensor is steady before you click Sample.
- The histogram shows how brightness values are distributed across the light map. Each bar counts how many grid squares have a similar light intensity. This helps reveal patterns such as overall brightness, contrast, and uneven lighting.
- I_mean is the average light intensity of all sampled squares. It represents the overall brightness of the scene.
- The vertical line at I_mean shows where the average brightness falls on the histogram. This helps compare typical values to darker and brighter regions.
- I_median is the middle brightness value when all squares are ordered from darkest to brightest. Half the squares are darker and half are brighter.
- The vertical line at I_median marks the center of the brightness distribution. Comparing it to the mean can reveal uneven or skewed lighting.
- I_min is the darkest measured square in the light map. It represents the lowest detected light level.
- I_max is the brightest measured square in the light map. It represents the highest detected light level.
- The range is found by subtracting I_min from I_max. It shows how much contrast exists between the darkest and brightest areas.
- Try covering part of the sensor with your finger while sampling. What pattern do you create in the grid?
- Try moving the flashlight in a straight line and sampling each square. Can you create a gradient?